What Is Event Monitoring?
Event here means user activity, Tracking and providing information for the same is called Event Monitoring. It is one of the tools of salesforce to help and keep your data secure by monitoring.
Event Monitoring Analytics App Prebuilt Dashboards
In simple terms, once you get license of Event Monitoring by default salesforce provide you 16 dashboard, and these dashboard covered almost all the events. Just you need to provide access to the profiles. Any modification on top, we can perform it by using existing datasets.
Salesforce provides 16 Dashboard broken into 3 key sector (Adoption, Performance and Security)
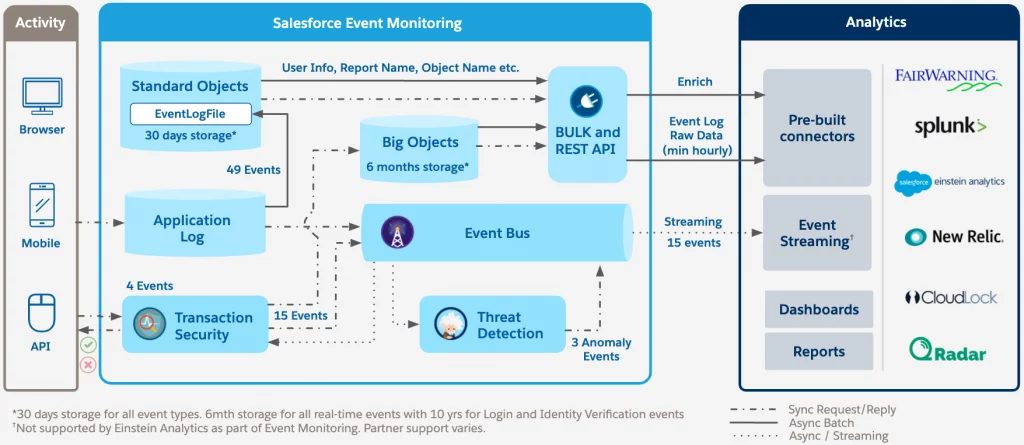
49 event types are made available to event monitoring customers by making a copy of those transactions into a standard object called EventLogFile and supporting file storage. This process is asynchronous in nature and operates in batch mode copying transactions hourly and daily. Given the vast volumes of application log captured Salesforce stores a rolling 30 days of activity. These logs contain a myriad of information useful for ascertaining who did what, when and how long it took.
All 49 event types are made available for 30 days. Transaction Security processes a subset of these in near real time — 15 events. These events can be streamed and stored (an administrator selects which events). These real time events are kept in scalable storage, backed by Apache HBase, for 6 months (Login and LoginVerification events for 10 years).
15 event types are also published to the Enterprise Messaging Platform, backed by Apache Kafka and other services, to be made available to subscribers. Subscribers can use CometD to subscribe to these events just like other events in Salesforce (Change Data Capture and Platform Events).
This streaming pattern allows for new services to be created. Internally as part of Spring ’20 release Salesforce has released a beta service called Threat Detection. Threat detection can subscribe to real time events being published to the event bus and conduct analysis on the events to determine if they are a potential security event.
Most of the dashboards represent a single event type on the EventLogFile object. The EventLogFile object reference contains detailed information about each event type. Let’s get a quick idea about what each dashboard does.
Analytics Adoption
Corresponds to the Wave Change, Wave Interaction, and Wave Performance event types. This dashboard shows Analytics usage and performance information.
Apex Executions
Corresponds to the Apex Execution event type. This dashboard lets you track trends in Apex code executions and performance.
API
Corresponds to the API Event event type. This dashboard gives you information about both your users’ API usage and API performance in your org. You can see how often each object is being used, how fast each object is being processed, and what methods are being invoked on that object.
Dashboards
Corresponds to the Dashboard event type. This dashboard helps you track dashboard adoption and performance.
Files
Corresponds to the Content Transfer event type. When users in your org perform content transfers (downloads, uploads, or previews), they show up on this dashboard. You can also track file adoption.
Lightning Adoption
Corresponds to the Lightning Interaction and Lightning Page View event types. Use this dashboard to see how users interact with Lightning Experience on the desktop and mobile devices.
Lightning Performance
Corresponds to the Lightning Error, Lightning Interaction, Lightning Page View, and Lightning Performance event types. Use this dashboard to optimize performance and user interactions with Lightning Experience and the Salesforce app.
Login-As
Corresponds to the Login As event type. This dashboard lets you see which admins are using the login-as feature and on which user accounts.
My Trust
The My Trust dashboard gives you an overall idea of what kind of events are taking place in your org over time. It also shows the average speed of these transactions. The dashboard corresponds to the following event types: Apex Execution, API, Content Transfer, Dashboard, Lightning Page View, Login As, Login, Report, Report Export, REST API, and Visualforce, all correlated by User IDs. For the My Trust dashboard to work, add all datasets to your app in the Configuration Wizard. This could impact your row utilization, depending on the number of events in your org.
Page Views (URIs)
Corresponds to the URI event type. This dashboard lets you see which pages users are accessing in the Salesforce desktop app.
Report Downloads
Corresponds to the Report Export event type. This dashboard lets you see which users are downloading your reports and where they’re downloading them from.
Reports
Corresponds to the Report event type. This dashboard shows you trends in reporting as well as which users are running specific reports. You can also find out which reports are having performance issues.
RestAPI
Corresponds to the REST API event type. This dashboard shows you trends in REST API usage and which endpoints are seeing the most traffic. You can also view information about the IP ranges issuing the requests and which methods are being called.
Setup Audit Trail
Corresponds to the Setup Audit Trail page in Setup. Use this dashboard to see the changes your users are making in the Setup area.
User Logins
Corresponds to the Login event type. This dashboard shows login trends by user and information about where and how users are accessing your org.
Visualforce Requests
Corresponds to the Visualforce Request event type. Here you can see trends in Visualforce adoption and page performance.
All these events are stored in event log files. An event log file is generated when an event occurs in your organization and is available to view and download after 24 hours. The event types you can access and how long the files remain available depends on your edition.
Developer Edition (DE) organizations have free access to all log types with one-day data retention.
Enterprise, Unlimited, and Performance Edition organizations have free access to the insecure external assets, login, and logout event log files with one-day data retention. For an extra cost, you can access all log file types with 30-day data retention.
Step By Step Process to implement Event Monitoring Analytics
Prerequisite :
The Fist Step which has to do by your organization admin manager or the respective person has to buy the license for Analytic Studio(For Event Monitoring Analytics) from Salesforce.
Steps under Salesforce Org (in your Sandbox):
Step: 1 Enable Analytics
In Setup, enter Analytics in the Quick Find box, then select Getting Started.
Click on Enable Analytics Button*.***
Step 2: Enable Analytics Settings
In Setup, enter Analytics in the Quick Find box, then select Settings.
Check all the check boxes except Enable Data Sync and Connections and Inherit sharing from Salesforce
Step: 3 Enable View Event Log Data in Analytics Apps
In Setup, enter Event in the Quick Find box, then select Event Monitoring Settings.
Select View Event Log Data in Analytics Apps
Step: 4 Assign a standard permission set to the respective user.
| Standard Permission Set | For |
|---|---|
| Event Monitoring Analytics Admin | Users who create and customize Event Monitoring Analytics apps and data flows |
| Event Monitoring Analytics User | Users who view Event Monitoring Analytics apps |
- Setup, enter Permission Sets in the Quick Find box, then select Permission Sets.
- Click the Event Monitoring Analytics User permission set.
- Click Manage Assignments.
- Click Add Assignments.
- Select Julie Chavez and click Assign.
- Click Done.
Steps to create App in Analytic Studio.
- From the App Launcher, select Analytics Studio.
- Click Create and select App.
- Click Create App from Template.
- Select Event Monitoring Analytics App, and then click Continue.
- In the Event Monitoring Analytics App – Personalize wizard, otherwise known as the configuration wizard, select the amount of data you want to include in your app. Each dataset corresponds to one or more prebuilt dashboards.
Since we’re going to focus on reports, we want the maximum amount of data possible for datasets: 30 days. So we choose 30 days for the Report and URI datasets, and accept the default values for all other datasets.
- On the Step 1 of 5 page, click Looks good, next without making any changes.
- On the Step 2 of 5 page, change the number of days of Report data to 30, then click Looks good, next.
- On the Step 3 of 5 page, change the number of days of URI data to 30.
- Click Looks good, next without making any other changes until you reach the area to name your app.
- Name your app Analytics for CIO and click Create.
This takes a few minutes, Soon, you’ll receive an email stating that the dataflow ran successfully, and you can move on to the next section.
Key terms of Einstein Analytics:
Dataset : Dataset are the tables of the data that are being pulled over from salesforce into Einstein Analytics.
Lens : A Saved Exploration of Data.
Dashboard : A set of charts, metrics, and tables that gives an interactive view of your data.
Apps: A Dynamic folder that contains a group of dataset, lenses and Dashboards that you can share with your colleagues.
Some troubleshooting ideas:
No data shown in Event Monitoring Analytics App
- Check if the datasets created by the Dataflow contains any data: In the Event Monitoring App, under Datasets, you would be able to see the datasets that the dashboards use. Check if those datasets have data and if yes, relate to the CSV file that you exported.
- Check the dataflow jobs: In data Manager, under Dataflow view, you can expand (hit +) the dataflow and see the number of input rows / output rows for each of the nodes. Check if sfdcDigest node is pulling any data.
- Check the dataflow: Edit the dataflow to see all the nodes. See if all the correct objects are being used to extract data from your org. If you are using custom objects, the dataflow might not be extracting data from it. Also see if the correct join fields are being used for augmenting data.
- Once the app got setup, if the dashboards only show 1 record, then wait for 24 hours, after 24 hours, rerun to the app, the data will reflect in the dashboards.
Also, if you still face the issue after wait 24 hours and rerun the app, just to reconfigure the app and wait another day to run the app. - Check your data limits, suppose you purchased event monitoring with 6M rows of data as a basic one, after you configure the app, your data might shows more than 6M rows in your datasets under data manager, then reach out to your salesforce AE to increase row limits upto 10B or 100B (max: 250B) as per your org users usage and operation statastics. you can check your data rows limit via: Click on setup –> Enter Einstine in searach –> click on getting started
Cheers!!

Good it’s very helpful for fresher thanks!!! 🙂
Good it’s very helpful for fresher thanks!!! 🙂