As of Winter ’15 release, Event Log Files has been Generally Available. It contains useful information for assessing organizational usage trends and user behaviour.
However, there is no access through Salesforce user interface, you only can access the data through the Force.com REST API, this mean you can write visual force page with apex code for the UI, but fear not, I’ll share few free app able to access the data.
Log files are generated asynchronous, one day after an event take place, but this should be good enough to understand your user usage. Log data is read-only, you can’t insert, update, or delete log data. It does NOT count towards org file storage.
For Production org (Enterprise, Unlimited, and Performance Edition), you need to purchase User Event Monitoring to get this feature fully activated, otherwise you will have free access to the login and logout log files with one-day data retention only. Once purchase, you can access all log file types with 30-day data retention.
Developer Edition (DE) organizations have free access to all log types with one-day data retention.
So, it is good idea to integrate this data to your back-end database for further analysis. Once it enabled, you will see object called EventLogFile from API.
Log Files have 32 event type:
• API
• Apex Callout
• Apex Execution
• Apex SOAP
• Apex Trigger
• Asynchronous Report Run
• Bulk API
• Change Set Operation
• Content Distribution
• Content Document Link
• Content Transfer
• Dashboard
• Document Attachment Downloads
• Login
• Login As
• Logout
• Metadata API Operation
• Multiblock Report
• Package Install
• Queued Execution
• Report
• Report Export
• REST API
• Sandbox
• Sites
• Time-Based Workflow
• UI Tracking
• URI
• Visualforce Request
• Wave Change
• Wave Interaction
• Wave Performance
Sample SOQL query:
Select Id, EventType, LogDate, LogFile, LogFileContentType from EventLogFile
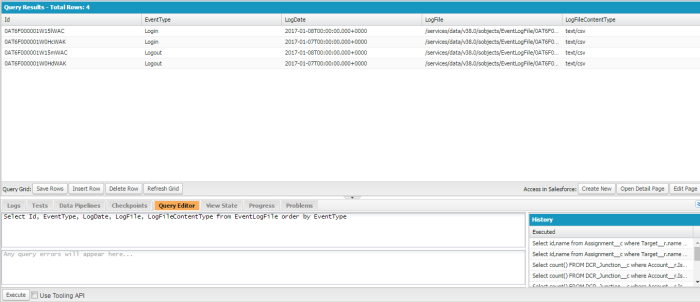
As you can see in query result, it will create a record for each LogDate by EventType. The content is stored in LogFile and you need to read it with code, or you can use REST tool for testing.
How to read the log file?
1. REST Explorer
Available for free from AppExchange. Once installed, you need to configure following:
1) Configure Base URL as Custom Setting
* Go to Setup | Develop | Custom Settings | Rest Explorer Configuration | Manage | New.
* Set the name to ‘baseUrl’ and the value to your Salesforce instance, for example ‘https://na1.salesforce.com’.
2) Configure a Remote Site Setting.
* Go to Setup | Security Controls | Remote Site Settings | New Remote Site.
* Set Remote Site Name to the name of your choice, and set Remote Site URL to the same value of the baseUrl above, for example ‘https://na1.salesforce.com’.
Then you can access it through a new tab created REST Explorer. Enter LogFile value from query above to the textbox provided.

This is the result for API EventType
 Raw Response
 Sforce-Limit-Info: api-usage=36/15000
 Date: Wed, 01 Oct 2014 23:38:12 GMT
 Transfer-Encoding: chunked
 Expires: Thu, 01 Jan 1970 00:00:00 GMT
 Set-Cookie: BrowserId=Ouz260FsTl6kC3LUW7VTQg;Path=/;Domain=.salesforce.com;
 Expires=Sun, 30-Nov-2014 23:38:12 GMT
 Content-Type: text/csv
 "EVENT_TYPE","TIMESTAMP","REQUEST_ID","ORGANIZATION_ID","USER_ID","RUN_TIME","CLIENT_IP","URI","REQUEST_STATUS","API_TYPE","API_VERSION","CLIENT_NAME","METHOD_NAME","ENTITY_NAME","ROWS_PROCESSED","REQUEST_SIZE","RESPONSE_SIZE","QUERY"
 "API","20140929223903.454","3tX96QXMYovdpU0CcVVk6-","00DB00000000Vgy","005B0000000ybnD","18","a.b.c.d","/services/data/v32.0/tooling/query/","S","","32.0","devconsole","query","UserPreference","0","","",""
 "API","20140929223903.516","3tX96QRNJyk4QU0CcVgkAk","00DB00000000Vgy","005B0000000ybnD","105","a.b.c.d","/services/data/v32.0/tooling/sobjects/User/005B0000000ybnD","S","","32.0","devconsole","retrieve","User","1","","",""
 "API","20140929223904.043","3tX96Se_dRhYFSHyqUDgI-","00DB00000000Vgy","005B0000000ybnD","34","a.b.c.d","/services/data/v32.0/tooling/query/","S","","32.0","","query","ApexExecutionOverlayAction","0","","",""
 "API","20140929223904.444","3tX96U8AoglYZSHyqU0xdk","00DB00000000Vgy","005B0000000ybnD","38","a.b.c.d","/services/data/v32.0/tooling/query/","S","","32.0","","query","ApexLog","0","","",""
 "API","20140929223905.164","3tX96WmjfEhYFhHyqUDgI-","00DB00000000Vgy","005B0000000ybnD","47","a.b.c.d","/services/data/v32.0/tooling/query/","S","","32.0","devconsole","query","IDEWorkspace","1","","",""
 "API","20140929223905.441","3tX96Xv75g988xHyqUCmFF","00DB00000000Vgy","005B0000000ybnD","21","a.b.c.d","/services/data/v32.0/tooling/query/","S","","32.0","devconsole","query","TraceFlag","1","","",""
 "API","20140929223905.671","3tX96YlO2KdYFhHyqUDgI-","00DB00000000Vgy","005B0000000ybnD","23","a.b.c.d","/services/data/v32.0/tooling/query/","S","","32.0","devconsole","query","MetadataContainer","1","","",""
 "API","20140929223906.008","3tX96ZnGj1T88xHyqUCmFF","00DB00000000Vgy","005B0000000ybnD","84","a.b.c.d","/services/data/v32.0/tooling/sobjects/TraceFlag/7tfB00000000J0zIAE","S","","32.0","devconsole","update","TraceFlag","1","","",""
 "API","20140929223906.032","3tX96Ywqmkt7BU0CcVFeSk","00DB00000000Vgy","005B0000000ybnD","337","a.b.c.d","/services/data/v32.0/tooling/sobjects/User/005B0000000ybnDIAQ","S","","32.0","devconsole","update","User","1","","",""
 "API","20140929223906.475","3tX96a4QSch7BU0CcVFeSk","00DB00000000Vgy","005B0000000ybnD","206","a.b.c.d","/services/data/v32.0/tooling/query/","S","","32.0","devconsole","query","MetadataContainerMember","0","","",""
 "API","20140929224424.784","3tX9P7Yw7Er2QxHyqUDeZk","00DB00000000Vgy","005B0000000ybnD","23","a.b.c.d","/services/data/v32.0/tooling/query/","S","","32.0","devconsole","query","ApexCodeCoverage","0","","",""
 "API","20140929224425.792","3tX9P8CnQYT8ISHyqUCmFF","00DB00000000Vgy","005B0000000ybnD","856","a.b.c.d","/services/data/v32.0/tooling/sobjects/ApexClass/01pB0000000AJ6QIAW","S","","32.0","devconsole","retrieve","ApexClass","1","","",""
 "API","20140929224426.238","3tX9PCh0VJnduE0CcVVk6-","00DB00000000Vgy","005B0000000ybnD","98","a.b.c.d","/services/data/v32.0/tooling/query/","S","","32.0","devconsole","query","ApexClass","10","","",""
 "API","20140929224426.430","3tX9PCnNTY34WE0CcVgkAk","00DB00000000Vgy","005B0000000ybnD","262","a.b.c.d","/services/data/v32.0/tooling/query/","S","","32.0","devconsole","query","ApexClass","1","","",""
 "API","20140929224512.669","3tX9RuvnfjKePE0CcVVMjk","00DB00000000Vgy","005B0000000ybnD","26","a.b.c.d","/services/data/v32.0/tooling/query/","S","","32.0","","query","ApexLog","1","","",""
 "API","20140929224527.721","3tX9Sn1k6qKYfhHyqU0xdk","00DB00000000Vgy","005B0000000ybnD","17","a.b.c.d","/services/data/v32.0/tooling/query/","S","","32.0","","query","ApexLog","2","","",""
 "API","20140929225015.272","3tX9iX7wbcq8TSHyqUCmFF","00DB00000000Vgy","005B0000000ybnD","47","a.b.c.d","/services/data/v32.0/tooling/sobjects/ApexPage/066B00000001YGXIA2","S","","32.0","devconsole","retrieve","ApexPage","1","","",""
 "API","20140929225905.190","3tXACN8ylBSehU0CcVVMjk","00DB00000000Vgy","005B0000000ybnD","69","a.b.c.d","/services/data/v32.0/tooling/sobjects/TraceFlag/7tfB00000000J0zIAE","S","","32.0","devconsole","update","TraceFlag","1","","",""
 "API","20140929230507.422","3tXAXSXhhkZ50U0CcVgkAk","00DB00000000Vgy","005B0000000ybnD","79","a.b.c.d","/services/data/v32.0/tooling/sobjects/IDEWorkspace/1deB00000000JIgIAM","S","","32.0","devconsole","update","IDEWorkspace","1","","",""
CLIENT_IP has been masked.
This is the result for Report Event Type
 Raw Response
 Sforce-Limit-Info: api-usage=37/15000
 Date: Wed, 01 Oct 2014 23:46:38 GMT
 Transfer-Encoding: chunked
 Expires: Thu, 01 Jan 1970 00:00:00 GMT
 Set-Cookie: BrowserId=Xcteq7xKS0uNZylaeBBafg;Path=/;Domain=.salesforce.com;
 Expires=Sun, 30-Nov-2014 23:46:38 GMT
 Content-Type: text/csv
 "EVENT_TYPE","TIMESTAMP","REQUEST_ID","ORGANIZATION_ID","USER_ID","RUN_TIME","CLIENT_IP","URI","REQUEST_STATUS","ENTITY_NAME","DISPLAY_TYPE","RENDERING_TYPE","REPORT_ID","NUMBER_EXCEPTION_FILTERS","NUMBER_COLUMNS","SORT","NUMBER_BUCKETS"
 "Report","20140929224335.668","3tX9MEjMd8xeOE0CcVVMjk","00DB00000000Vgy","005B0000000ybnD","520","222.165.97.180","/00OB0000000YEn2","S","","S","W","00OB0000000YEn2","0","10","","0"
 "Report","20140929224340.773","3tX9MZQw71teOE0CcVVMjk","00DB00000000Vgy","005B0000000ybnD","68","222.165.97.180","/00OB0000000YEn2","S","","S","X","00OB0000000YEn2","0","10","","0"
 "Report","20140929224344.199","3tX9MkwB0pk4Vz0CcVgkAk","00DB00000000Vgy","005B0000000ybnD","139","222.165.97.180","/00OB0000000YEn2","S","","S","W","00OB0000000YEn2","0","10","","0"
Credit and thanks to Adam Torman for sharing sample code, how to access Event Log File via Visualforce and Apex code.
2. Developer Workbench
From https://workbench.developerforce.com login with API version 32.0 or beyond. Go to utilities | Rest Explorer, query with
/services/data/v32.0/query?q=SELECT+Id+,+EventType+,+LogFile+,+LogDate+,+LogFileLength+FROM+EventLogFile
Click Execute button, it will show total record the same as you query from Developer Console.
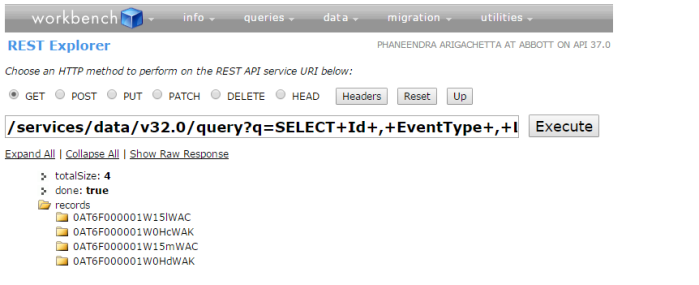
From here, click Expand All link to see all record in detail, then click link at LogFile
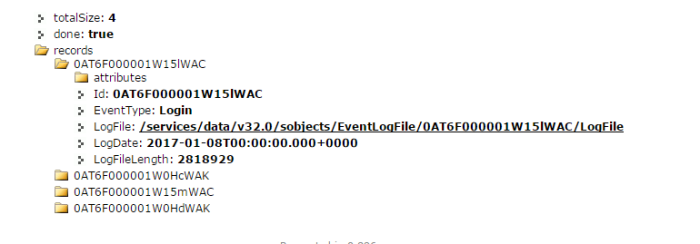
It will display Raw Result the same as using Rest Explorer installed package above. You can copy and paste the result from header “EVENT_TYPE”,”TIMESTAMP” … into Notepad and save as CSV file.
Sample CSV file for Event Type = ReportExport.
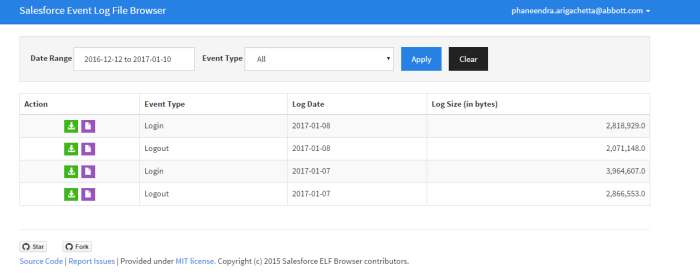
3. Salesforce Event Log File Browser
Go to URL https://salesforce-elf.herokuapp.com
This application is pretty simple, open the URL above, select login to Production or Sandbox and allow Salesforce Event Log File Browser to access your Salesforce data.
Once you are in, you can download each event log into CSV file.
Some of the main uses for Event Monitoring are:
Data Loss Monitoring:
(see data which has been exported, catch unethical behavior before it costs our company money and lost sales)
Compromised Users:
(we can see spikes in LogIns and possibly identify if any users have been compromised)”
Performance Optimization:
(with our Users being worldwide we can monitor and debug why some users reports or pages are loading more slowly than others such as if it’s a network issue or the way something is configured)
Increase Adoption:
(watch to see how well new features are adopting and who has a better time utilizing our SalesForce Org than others, identify both the good and the bad which need help)
Reference: